Technical Metrics Required To Assess Of Human/People Detection Solution

Human detection with bounding box

Summary

“Artificial intelligence (AI) is driving a substantial part of the automation potential, and it can unlock $85 billion of value for businesses.”
Written For
  • Product Managers and Engineers evaluating Human/People detection algorithms to identify the right fit algorithm for your use-case

Introduction

In recent years, human/people detection in a video-scene has attracted more attention due to its wide range of applications, including abnormal event detection, counting people in a dense crowd, individual identification, gender classification, and fall detection for older adults. The task of human detection in an array of aerial images is quite challenging due to various reasons.

This blog post addresses the accuracy metrics commonly used in assessing a human detection solution. Before getting into its details, let’s first understand the how and what of human detection.

It includes two primary elements when approaching human detection with the assistance of computer vision applications. The first is technical, like identifying an individual either in an image or a video. The second element is what you can do with those outcomes.

What Is Human/People Detection?

Human detection is the task of computer vision systems for locating the human beings present in an image or video; through this feature, we can customize the video and alert preference to decide whether you want to look after video and alerts for all motions. This human detection technique has two different approaches:

1. Bounding Box detection approach:

This approach detects the human with bounding box values as output. The bounding box is a rectangle over images, outlining the object of interest (in this case, Humans) within each image by defining its X and Y coordinates and Width and Height.

Street View
Figure 1 (Human detection with bounding box)
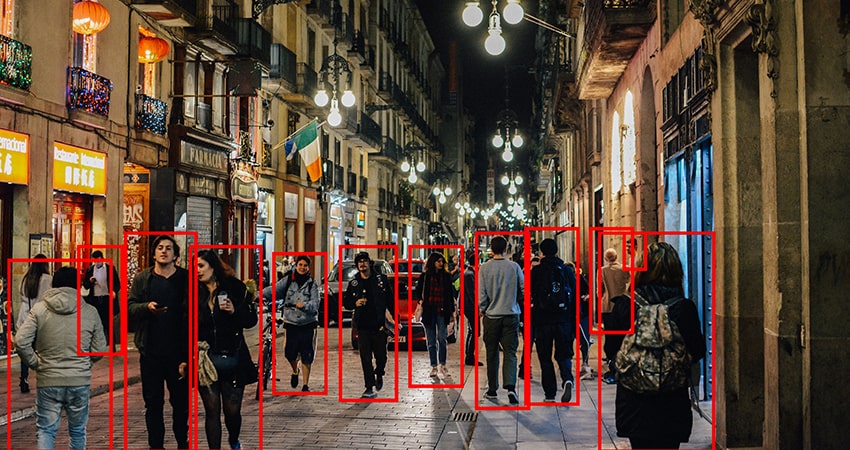
What is a bounding box?
The bounding box is an imaginary rectangle that acts as the point of reference for object detection.

In Figure 1, we can see that detected people with a bounding box (a red rectangle outlining each people in an image) as output.

2. Segmentation approach:
Dividing an image based on pixels’ characteristics. This approach groups together the pixels with similar attributes and creates a pixel-wise mask for each object’s appearance. On the other hand, this approach gives us a far more granular understanding of the picture’s object(s).

It can be of two types:

(a) Semantic segmentation: In this method, we label each image based on the pixels with a corresponding class of what is represented. Every pixel belongs to either of the two classes (background or person). All the pixels belonging to a particular class highlighted in the same color.

Semantic segmentation
Figure 2: Semantic segmentation

In Figure 2, we can see that both persons represented with the same color mean the same class (Person), and the background in another color represents another class.

(b) Instance segmentation: A process of partitioning a digital picture into numerous segments. In this method, each image’s pixel has been apportioned into a specific class. However, different objects of the same class have different colors. Instance segmentation aims to simplify and change the portrayal of a picture into something more significant and agreeable to examine
Instance Segmentation
Figure 3: Instance segmentation

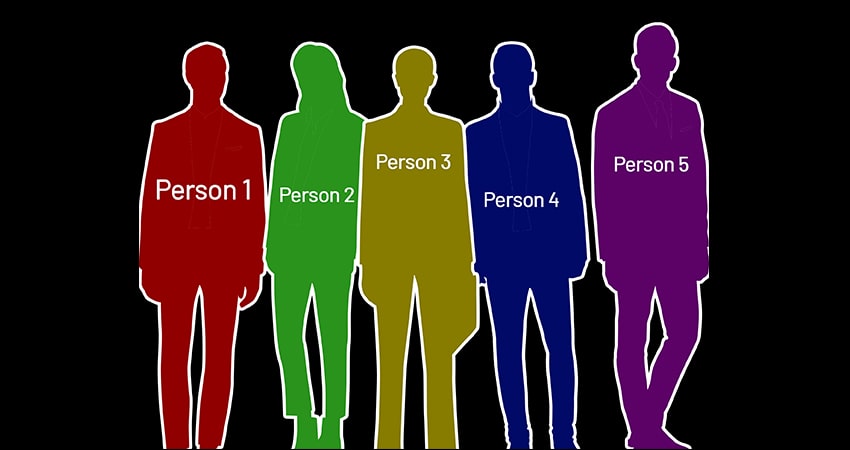
In Figure 3, we can see that all are of the same class(person) but have different colors representing different person instances.

Now that we know the people detection task, this article details the metrics used for measuring accuracy value in the bounding box detection approach.

Accuracy Metrics

The most commonly used accuracy matrices in the bounding box detection approach are
1. Average Precision (AP)
2. Mean Average Precision (mAP)
Before getting in deep about the above detection metrics, let’s familiarize ourselves with the terms used for defining the object detection metrics.
Terms Involved
  • Ground Truth
  • True positive; false positive; true negative; false negative
  • Precision
  • Recall
  • IOU (Intersection over Union)
Ground Truth (GT): is defined as the hand-labeled bounding boxes that specify where in the image the actual objects are. The GT data enables the calibration of remote-sensing data and helps interpret and analyze what is being used.
True Positive (TP): is a result where the model correctly envisions the positive class OR a correct detection.
True Negative (TN): is a result where the model correctly envisions the negative class OR a correct misdetection.
False Positive (FP): is a result where the model incorrectly predicts the positive class OR a wrong detection.
False Negative (FN): is an outcome where the model incorrectly predicts the negative class OR a ground truth not detected.

Now to put together the above terms concerning our target class Person.

TP: Model predicted that this is a person and it’s is a person.
TN: Model predicted that this is not a person and it’s not a person.
FP: Model predicted that this a person, but it’s not.
FN: Model predicted that this is not a person, but it’s is a person.
Here’s the visual representation of the above terms can also be visually represented as a confusion matrix.
Figure 4: Confusion Matrix
So, by now, we understand the above terms. Now let’s discuss Precision and Recall, which are built upon these terms.

Precision is a model’s ability to identify only the relevant objects, meaning it estimates how precise your prediction. It is the percentage of correct positive predictions and is given by:

Precision = TP / (TP+FP) = TP / (all detections) ——- eq1

A recall is a model’s ability to find all the relevant cases (all ground truth bounding boxes). In other terms, it determines how good you identify all the positives. It is the percentage of true positive detected among all relevant ground truths and is given by.

Recall = TP / (TP+FN) = TP / (all ground truths) ——- eq2

For instance, consider an image that is having five people. A model that finds only one of these five (but correctly labeling it as a person) has perfect precision but imperfect recall.

Intersection over Union (IOU) is a measure that evaluates the overlap between ground truth annotated bounding boxes and predicted bounding boxes. In a few datasets, we predetermine an IoU threshold in classifying whether the prediction is a true positive or a false positive.

IOU = Area of overlap / Area of union —— eq3

Instance segmentation
Figure 5: Intersection Over Union (IOU)
By looking at the above Figure, we can see that IOU is simply a ratio. The lower the IOU, the worse the prediction result.
Average Precision (AP): is a popular metric in measuring object detectors’ accuracy like SSD ( single-shot detector ), YOLO (You Only Look Once), etc. Here we compute the average precision value for recall value over 0 to 1. The general definition for Average Precision (AP) is finding the area under the precision-recall curve. Before going deeper into Average precision, let’s first discuss the precision-recall curve.
Precision-Recall curve: The precision-recall curve shows the tradeoff between precision and Recall for different thresholds. A high area under the curve represents high recall and high precision, where high precision relates to a low false-positive rate, and high recall relates to a low false-negative rate.
Let’s take an example in demonstrating the calculation of the average precision.
In this instance, there are five people in an image. We collect all the predictions made for people in an image (let’s consider, we have 15 predictions) and rank it in descending order according to the predicted confidence level. The second column indicates whether the forecast should be considered either true or false.
In this instance, the prediction is true, only if IOU >=0.5 with ground truth.

Rank (Confidence Score)

True or False (IoU >= 0.5)

Precision

Recall

1(0.99)

True

1.0

0.2

2(0.98)

True

1.0

0.4

3(0.96)

True

1.0

0.6

4(0.95)

False

0.75

0.6

5(0.94)

True

0.8

0.8

6(0.91)

False

0.66

0.8

7(0.90)

False

0.57

0.8

8(0.89)

False

0.5

0.8

9(0.88)

False

0.44

0.8

10(0.86)

True

0.5

1.0

11(0.75)

12(0.73)

13(0.68)

14(0.67)

15(0.65)

Let’s take only those predictions whose confidence score is greater than or equal to 0.85. Our prediction from 11 to 15 will be discarded as the confidence score is lower than our threshold.
Let’s take the row with rank 4 and see how precision and recall are calculated for that row.
From eq1 and eq2, we know precision and Recall so we can easily calculate:

Precision = TP / (all detections) =>3 / 4 = 0.75
Recall = TP / (all ground truths) => 3 / 5 = 0.6

From the table, we can see that Recall values rise as we go down the prediction ranking. However, precision has a zig-zag pattern-it goes down when it encounters false positives and goes up when it meets true positives.

Let’s Plot the precision against the recall for the above table values to see this zig-zag pattern.
A graph plotted in the zig-zag pattern representing the Average precision is the area under the precision-recall curve
Precision and recall are always between 0 and 1. Therefore, AP is also between 0 and 1. Before calculating AP for object detection, we often smooth out the zig-zag pattern first. Graphically, at each recall level, we replace each precision value with the maximum precision value to the right of that recall level so that curve will decrease monotonically instead of the zig-zag pattern.
A graph plotted in the zig-zag pattern representing the precision against the recall

Average precision is the area under the precision-recall curve. There are three areas A1, A2, and A3 that we can see from the above graph to sum up, to get the AP.

A1 = (0.6-0.0) * (1) = 0.6
A2 = (0.8-0.6) * (0.8) = 0.16
A3 = (1-0.8) * (0.5) = 0.1
AP = A1 + A2 + A3
AP = 0.6 + 0.16 + 0.1 = 0.86

For a model to avoid more false positives, we can set its confidence threshold higher, which gives high precision predictions at the expense of lowering its amount of recall. So, in the above case, we are taking only those predictions whose confidence score is >=0.85, if we increase our confidence score threshold to 0.93, we have more precise detection, but we missed our one ground truth.

Mean Average Precision(mAP): The calculation of AP only involves one class. But in object detection, we can have more than one class. So, the Mean Average Precision is defined as the mean of AP across all classes. For people detection, we have only one class (i.e., person), so AP=mAP.

Metrics explained for different cases

  • What would be the mAP value when Ground Truth (GT) and Prediction are the same?
The mAP will be the maximum value, i.e., 1.0, because the Precision and Recall will remain 1.0 as there is no FP or FN, making the mAP be 1.0.
  • What would be the mAP if there is no match with GT?
The mAP will be minimum, i.e., 0, because our TP is 0, making the Precision and Recall equals 0, hence our mAP will be 0.
  • What would be the mAP if there are more FP (False Positives) in prediction in addition to predicting all GT (Ground Truth)?
Since FP reduces the Precision value, mAP will also decrease for the increase in FP. So, high FP will reduce the mAP even though TP is high.
  • What is the minimum recommended IoU value for people detection mAP computation?
There is no hard-and-fast rule for selecting IoU for accurate computation. We recommend a minimum of 0.5 IoU for accuracy computation, i.e., if IoU >= 0.5, it should be considered good detection.
Figure 9: Examples for IoU of > 0.5
Above Figure 9 projects different GT and Prediction combinations with IoU of all combinations >= 0.5. You can see a good overlap for IoU at 0.5, so it is good enough for people detection, but for any critical use cases, it is recommended to go for higher IoU.

To discover more, we cheer you to check out our company website on https://visailabs.com/

VisAI Platform For Human/People Detection Solution

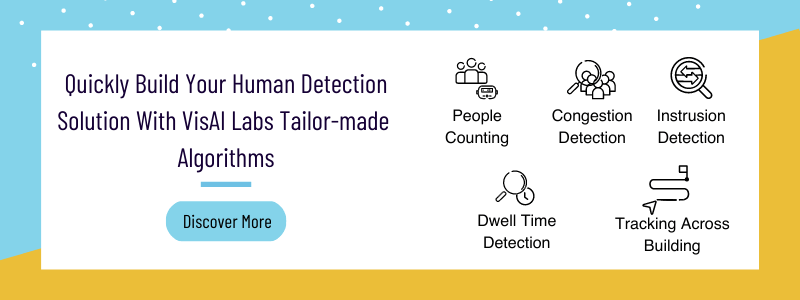
VisAI Labs has understood the need for robust edge optimized Human/people detection algorithms that can satisfy a wide range of use cases and comes pre-tested across various testing scenarios so that you could focus on building your product/solution.

VisAI Labs Human/People detection algorithms are optimized for People counting, Congestion detection, Dwell Time detection, Intrusion detection, Social distancing checker, and Tracking across buildings.

Feel free to reach us at sales@visailabs.com

Share this post
Need help to accelerate your Computer Vision journeys?

Thank you